
Website Analytics Benchmarks
When you’re diving into the sea of data that Google Analytics collects for your website, it’s easy to feel overwhelmed or not understand what all of the metrics are telling you. In this article, we’re going to take a look at some of the more commonly used metrics, such as bounce rate, time on site, pageviews, conversions, and what the generally accepted website analytics benchmarks are for each, based on information provided by Google and by various SEO experts in the field today.
What is Bounce Rate?
Google defines a “bounce” as a single-page session on your website. That is, when a visitor follows a link to your website and leaves the website without visiting other pages. Your website’s bounce rate is simply the number of all single-page sessions (bounces) divided by the total number of all sessions on your website.
When viewing bounce rates, it’s important to keep your website’s goal in mind. If your goal is to sell a product or to get visitors to explore your website, then a high bounce rate is a major warning sign. However, if your website is geared to provide all the necessary information on a single page, a high bounce rate is probably a good sign. It means they didn’t have to search your website or go to other pages to find what they needed; everything was in one place and your website is performing exactly as you want it to.
Bounce Rate Standards
Bounce rates don’t currently have an across the board standard, as each website has a different goal, and each goal has a different bounce rate. Also, contact us pages and blogs will typically have high bounce rates, as visitors are looking solely to interact with that page alone. Under the lens of a worldwide “average” bounce rate benchmark, anything over 50% is considered high and worth taking a look at, and anything between 20-50% is considered low. Anything under 20% is likely an error. Again, these are worldwide standards. If a website is over 50% bounce rate, it doesn’t mean the website is performing poorly. You simply need to then look at the purpose of the website and if the bounce rate reflects it well. If anything, bounce rate is best used to give you information on visitors and their experience on your site.
Bounce Rate Benchmarks (per Google Analytics)
- Landing pages with one call to action: 70-90%
- Content Websites: 40-60%
- Lead Generation: 30-50%
- Blogs: 70-98%
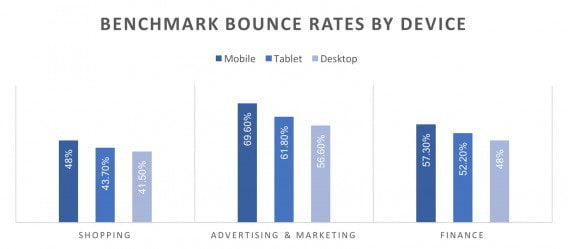
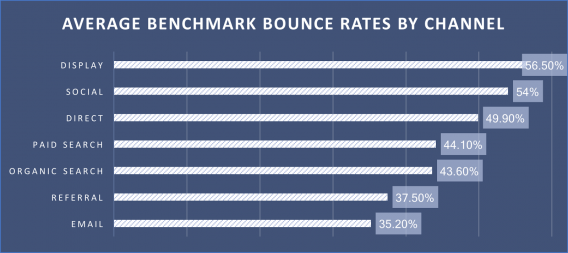
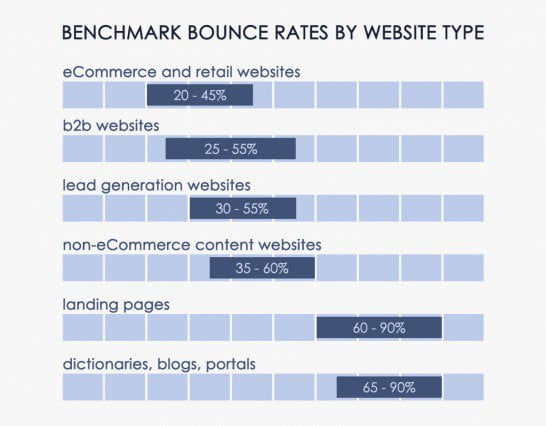
The following are some helpful graphs that provide a closer look at bounce rate benchmarks by device, industry, channel, and device type (all graphs are courtesy of CXL).
Time on Site Benchmarks
Anything under 20 seconds is a major red flag, as that’s barely enough time for a visitor to look at the page, much less read its content. 40-50 seconds is a great start, as it means you have their attention. In general, anything over 2 minutes is the accepted standard for websites.
Pageview Benchmarks
Pageviews are much like bounce rates; there is no universal benchmark. Again, if your website is information based, a single pageview could mean your website is doing exactly what it’s supposed to do: provide everything in one place. For the sake of discussion, however, let’s look at the e-commerce industry standards:
- 1.58 sessions/user
- 5 avg. pages/session
- 3 mins avg. session duration
- 41.26% bounce rate
What does this tell us? For e-commerce, having a high number of pages/session is good, as you want people to browse their products. Having a sessions/user number that is higher than 1 is ideal, as it means visitors are returning to the site at least once. A 3 min average session duration is also good, as that’s a very good time for a user to spend on a website (remember, 40-50 seconds good and 2+ minutes is the benchmark). Lastly, a 41.26% bounce rate means over half of their visitors are going beyond their landing page and interacting with the site, which is exactly what you want to see.
Conversion Rate Benchmarks
The average conversion rate in Google Ads across all industries is 3.17% on the search network and 0.46% on the display network. Using the health & medical industry as an example, the 2018 averages were as follows:
- 3.27% CTR for search ads
- 0.59% CTR for the Google Display Network
- 3.36% avg. conversion rate for search ads
- 0.82% avg. conversion rate for the Google Display Network
Other Useful Information
- In 2016, 42% of companies had hired a content strategist executive.
- As of 2017, content marketing (i.e. blogs) gets 3x more leads than paid search advertising.
We hope this has been a helpful overview of some of Google Analytics’ most commonly used metrics and that you have gained a deeper understanding of what these metrics can tell you about not only the performance of your website, but also the visitor experience and engagement with your content.